Dashboards
MetaLens VGC
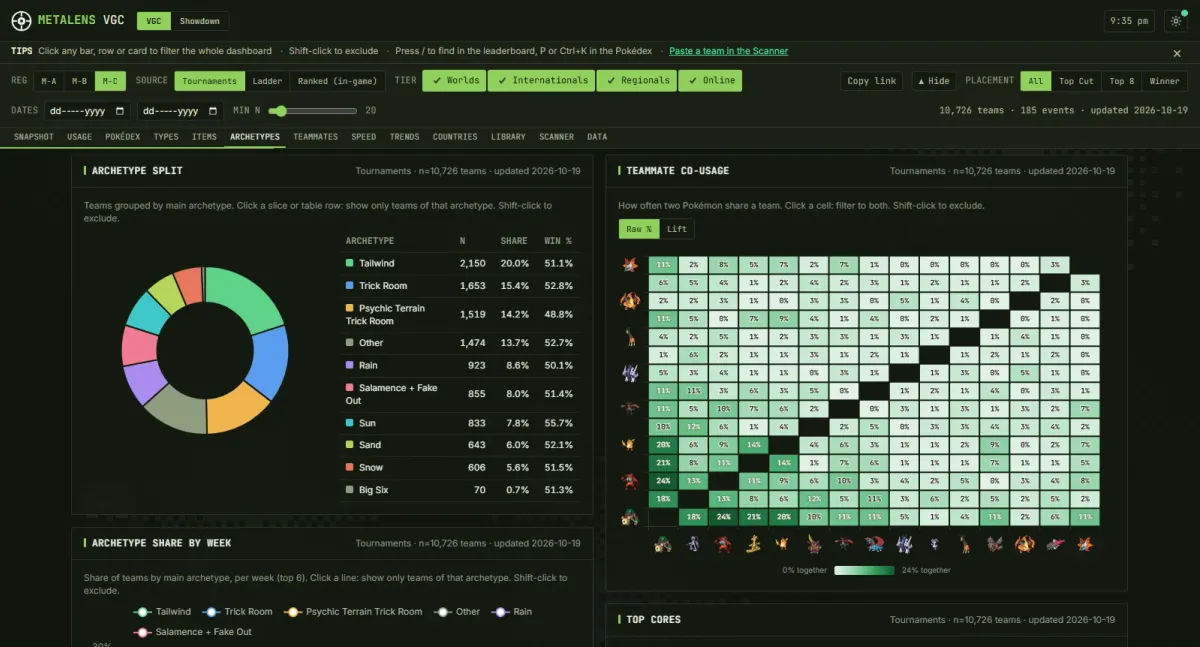
A cross-filtering metagame dashboard for Pokémon Champions VGC 2026, built from real tournament and ladder data.
View live (opens in a new tab)View code (opens in a new tab)
- Role
- Solo designer and developer
- Timeframe
- Sep 2026 - Nov 2026
- Weekly, automaticData refresh
- 20Section modules
- 144Commits
Problem
Metagame numbers for Pokémon Champions VGC are scattered across tournament team sheets and ladder statistics, and are easy to misread or over-claim.
Approach
- A data pipeline pulls real tournament team sheets and ladder statistics.
- The browser aggregates every number itself, using Wilson intervals, and shows "Insufficient data" instead of guessing.
- Every chart cross-filters, and the filter state lives in the URL so a view can be shared.
Result
A free, static dashboard on Cloudflare Pages that refreshes weekly through GitHub Actions with failure alerting.
- Tournament and ladder data
- Pipeline
- In-browser aggregation
- Cross-filtering dashboard
Problem
Metagame numbers for Pokémon Champions VGC are spread across tournament team sheets and ladder statistics. Raw usage tables are easy to misread, and small samples invite over-claiming. The goal was one place where every figure traces back to real data and says so when there is not enough of it.
Approach and decisions
The dashboard is static: plain JavaScript ES modules with ECharts vendored and no build step. A Node pipeline (scripts/sources/ for Limitless, ladder, ranked and official data, plus build-data.js) writes JSON into public/data/. All aggregation is pure code in public/js/lib, run in the browser, so each number can be recomputed and unit-tested. Win rates carry Wilson confidence intervals, and a widget shows “Insufficient data” rather than a guess.
Filtering is cross-cutting: clicking a Pokémon, type, item, move, archetype, core or team adds a chip and every chart recomputes. The filter state lives in the URL hash, so a view can be shared as a link. A weekly GitHub Actions run (Monday 00:00) refreshes the data, with an HTTP cache, a step timeout and an issue opened if it fails.
What broke and how it was fixed
- A negated team chip leaked into the Team Scanner field.
- Type-chart clicks and tooltips crashed, and one tooltip showed “usage: NaN%”.
- The ranked refresh failed when a season fell outside every regulation; it now skips those seasons.
- First load shifted the layout; reserving space cut the shift.
npm auditfindings were cleared through dependency overrides.
Results
The site is live on Cloudflare Pages, with 144 commits between 2026-09-28 and 2026-11-05. The browser code is about 11,100 lines across 20 section modules, and the weekly refresh runs without manual steps. The repository is public.
What’s next and limits
The data is only as complete as the public sources, and widgets say “Insufficient data” instead of guessing. It is a read-only analysis tool, not a team builder, and the vendored charting library means chart upgrades are manual.
Screenshots
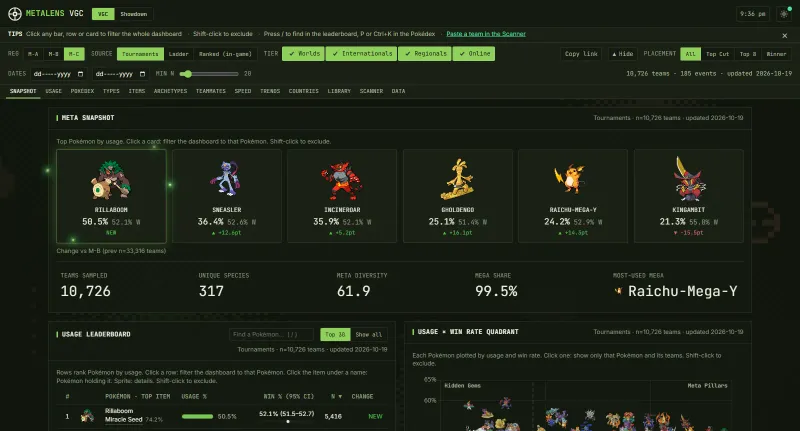
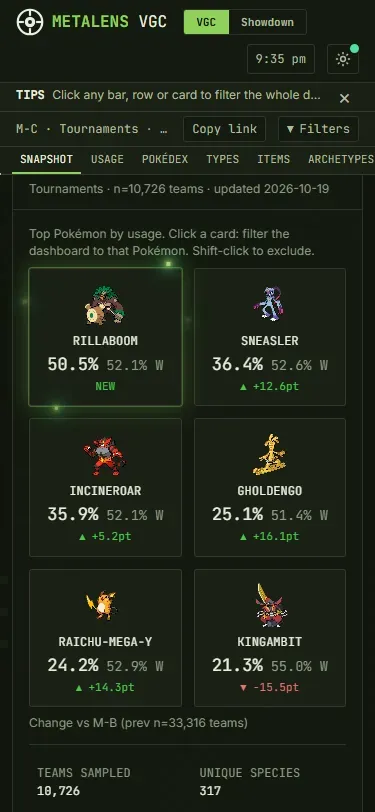
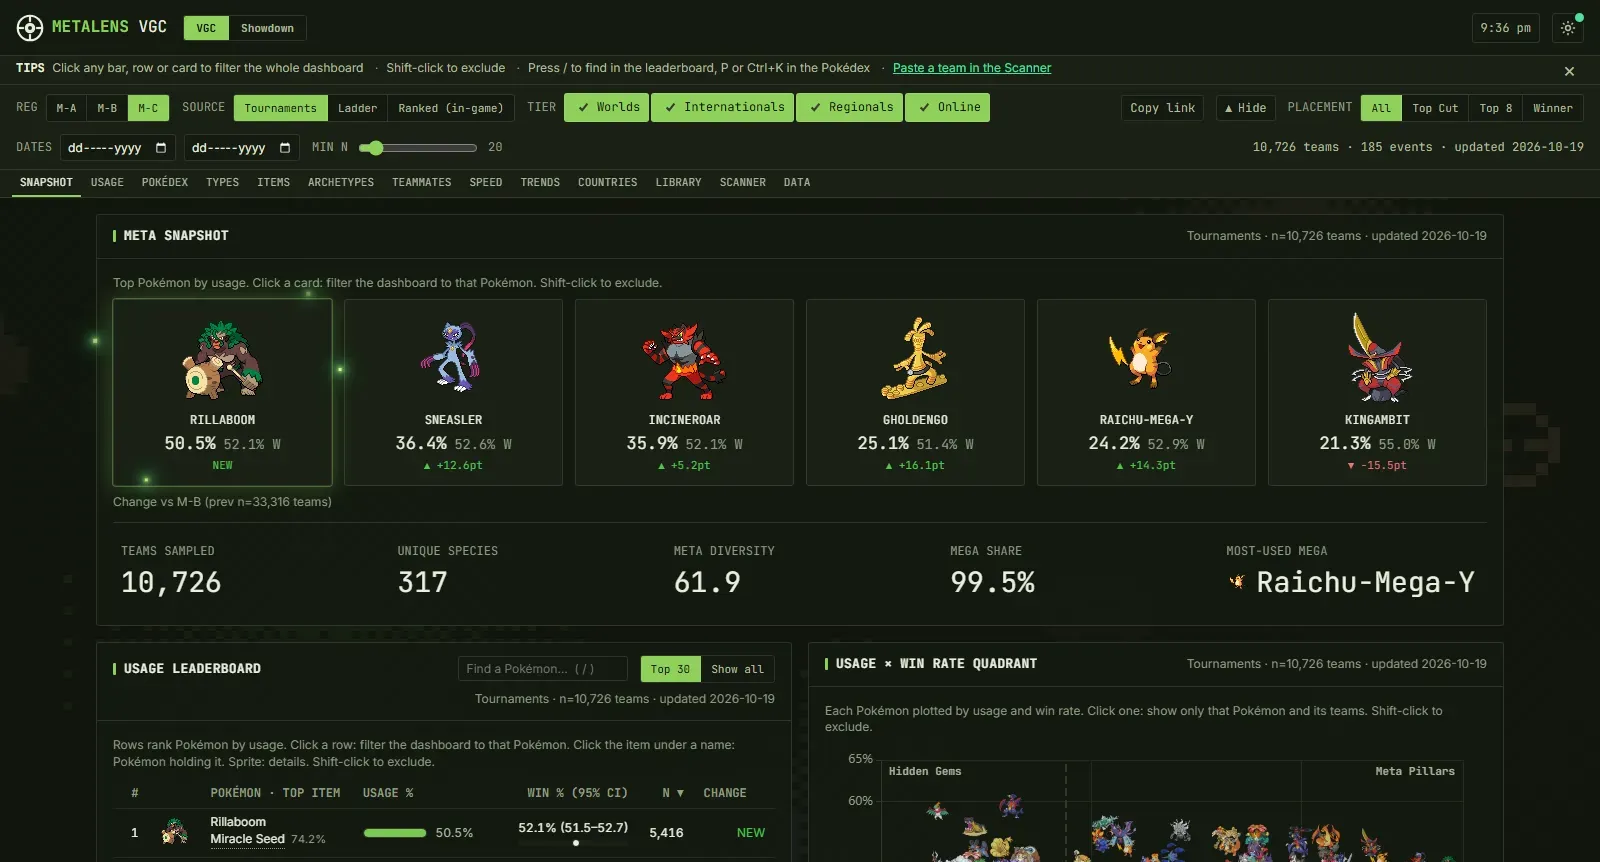
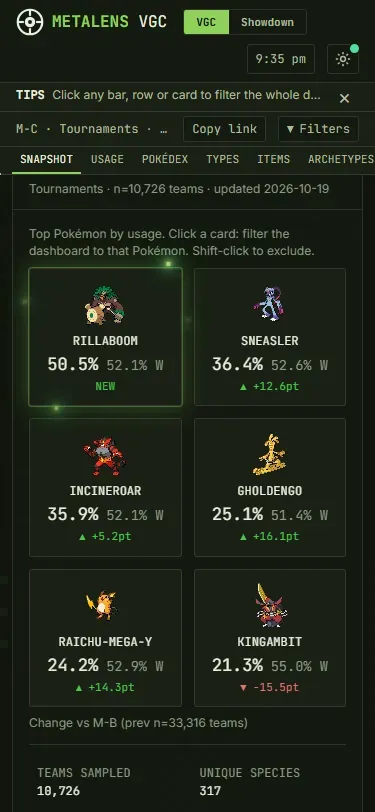
Meta snapshot, the dashboard's landing view. 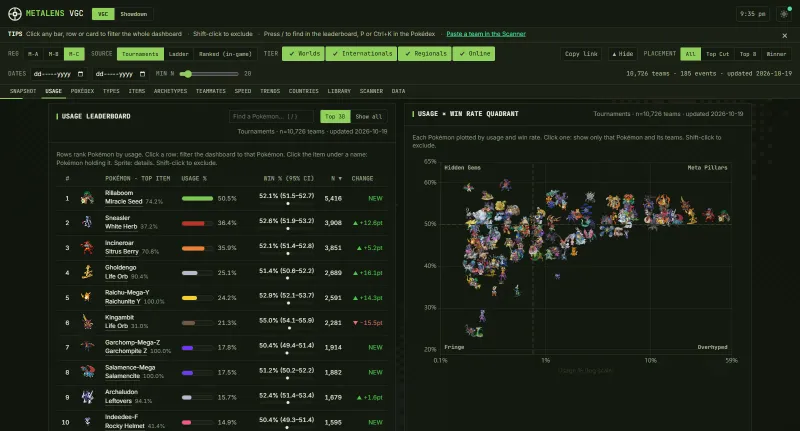
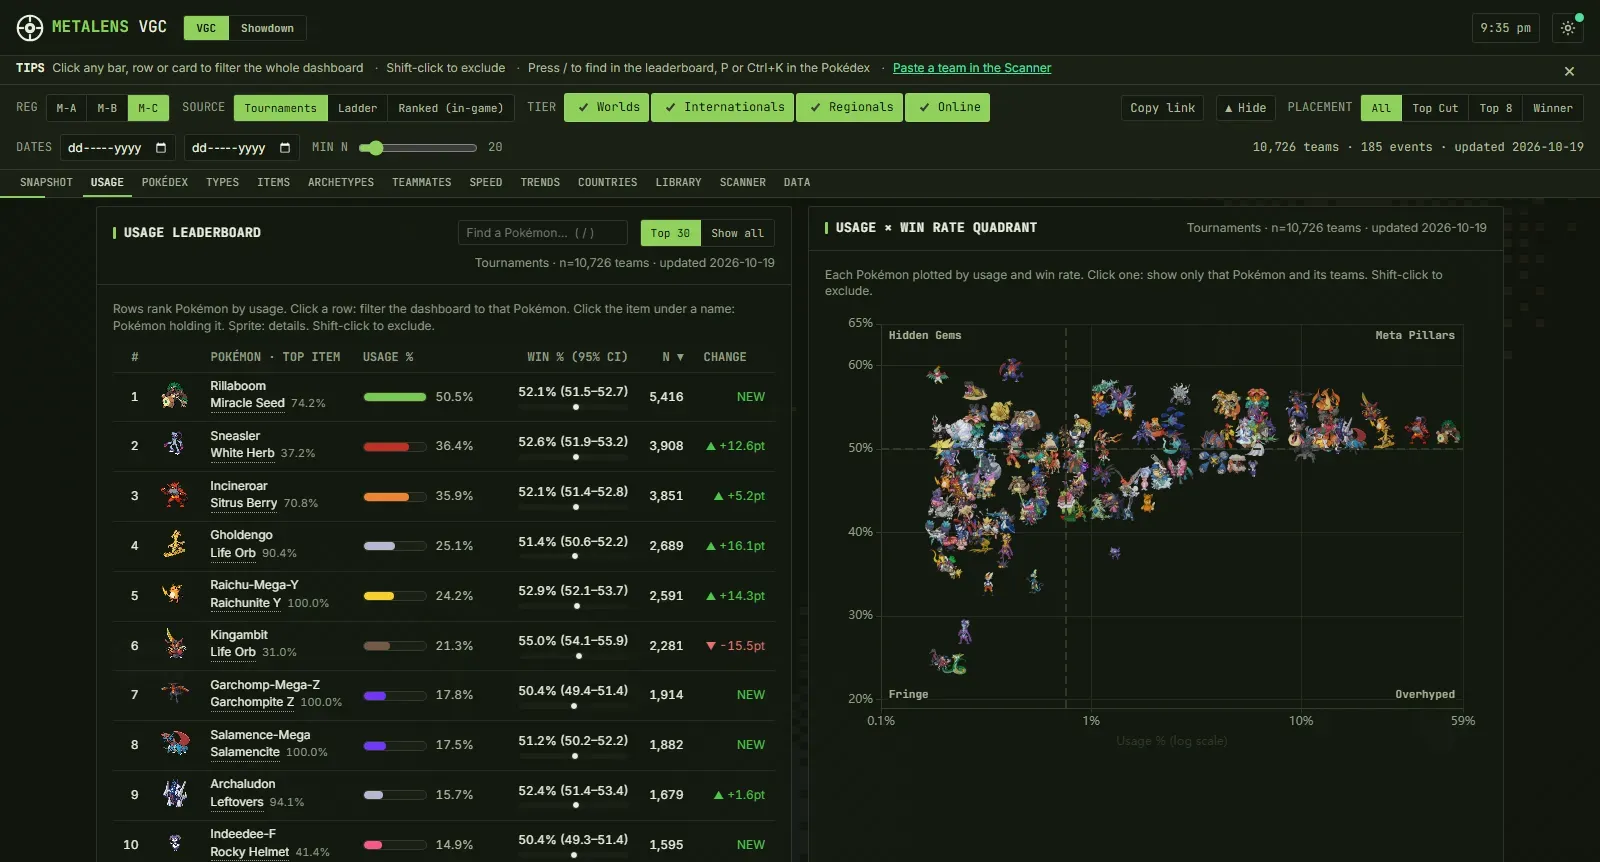
Usage leaderboard and the usage × win-rate quadrant.